I conducted a number of interviews with senior management and client representatives to try to gain an understanding of our typical users - who they are, their goals, environment, pain points with the existing system and key tasks. I documented these findings as Personas, which were used by our delivery team throughout the design process to help steer the design and to also serve as a starting point for future research.
"I want to see all my worldwide insurance coverage that the WTW network handles in a central location, so that I can manage the company insurance portfolio effectively"
Environment
Wills Online

Microsoft Outlook

Network Devices

Desktop / Laptop
Goals
Karen assesses the potential risks to the profitability or existence of the company. Karen put plans in place if things go wrong and decides how to avoid, reduce or transfer risks.
As a risk manager she is responsible for managing a diverse and distributed portfolio of exposures and the associated risk transfer solutions.
Pain Points
- The Willis Online system looks a bit outdated compared to what other brokers offer in the market
- Lack of integration with other systems
- People aren’t keeping it up to date today due to a lack of communication and discipline
-
No graphs or analysis tools such as:
Charts showing trends and variances, which would make it easy to identify any trends or highlight potential changes.
Well formatted reports that can be downloaded into Excel where further analysis can be performed.
Data visualization or premium allocation by Local Insured.
Scenarios
-
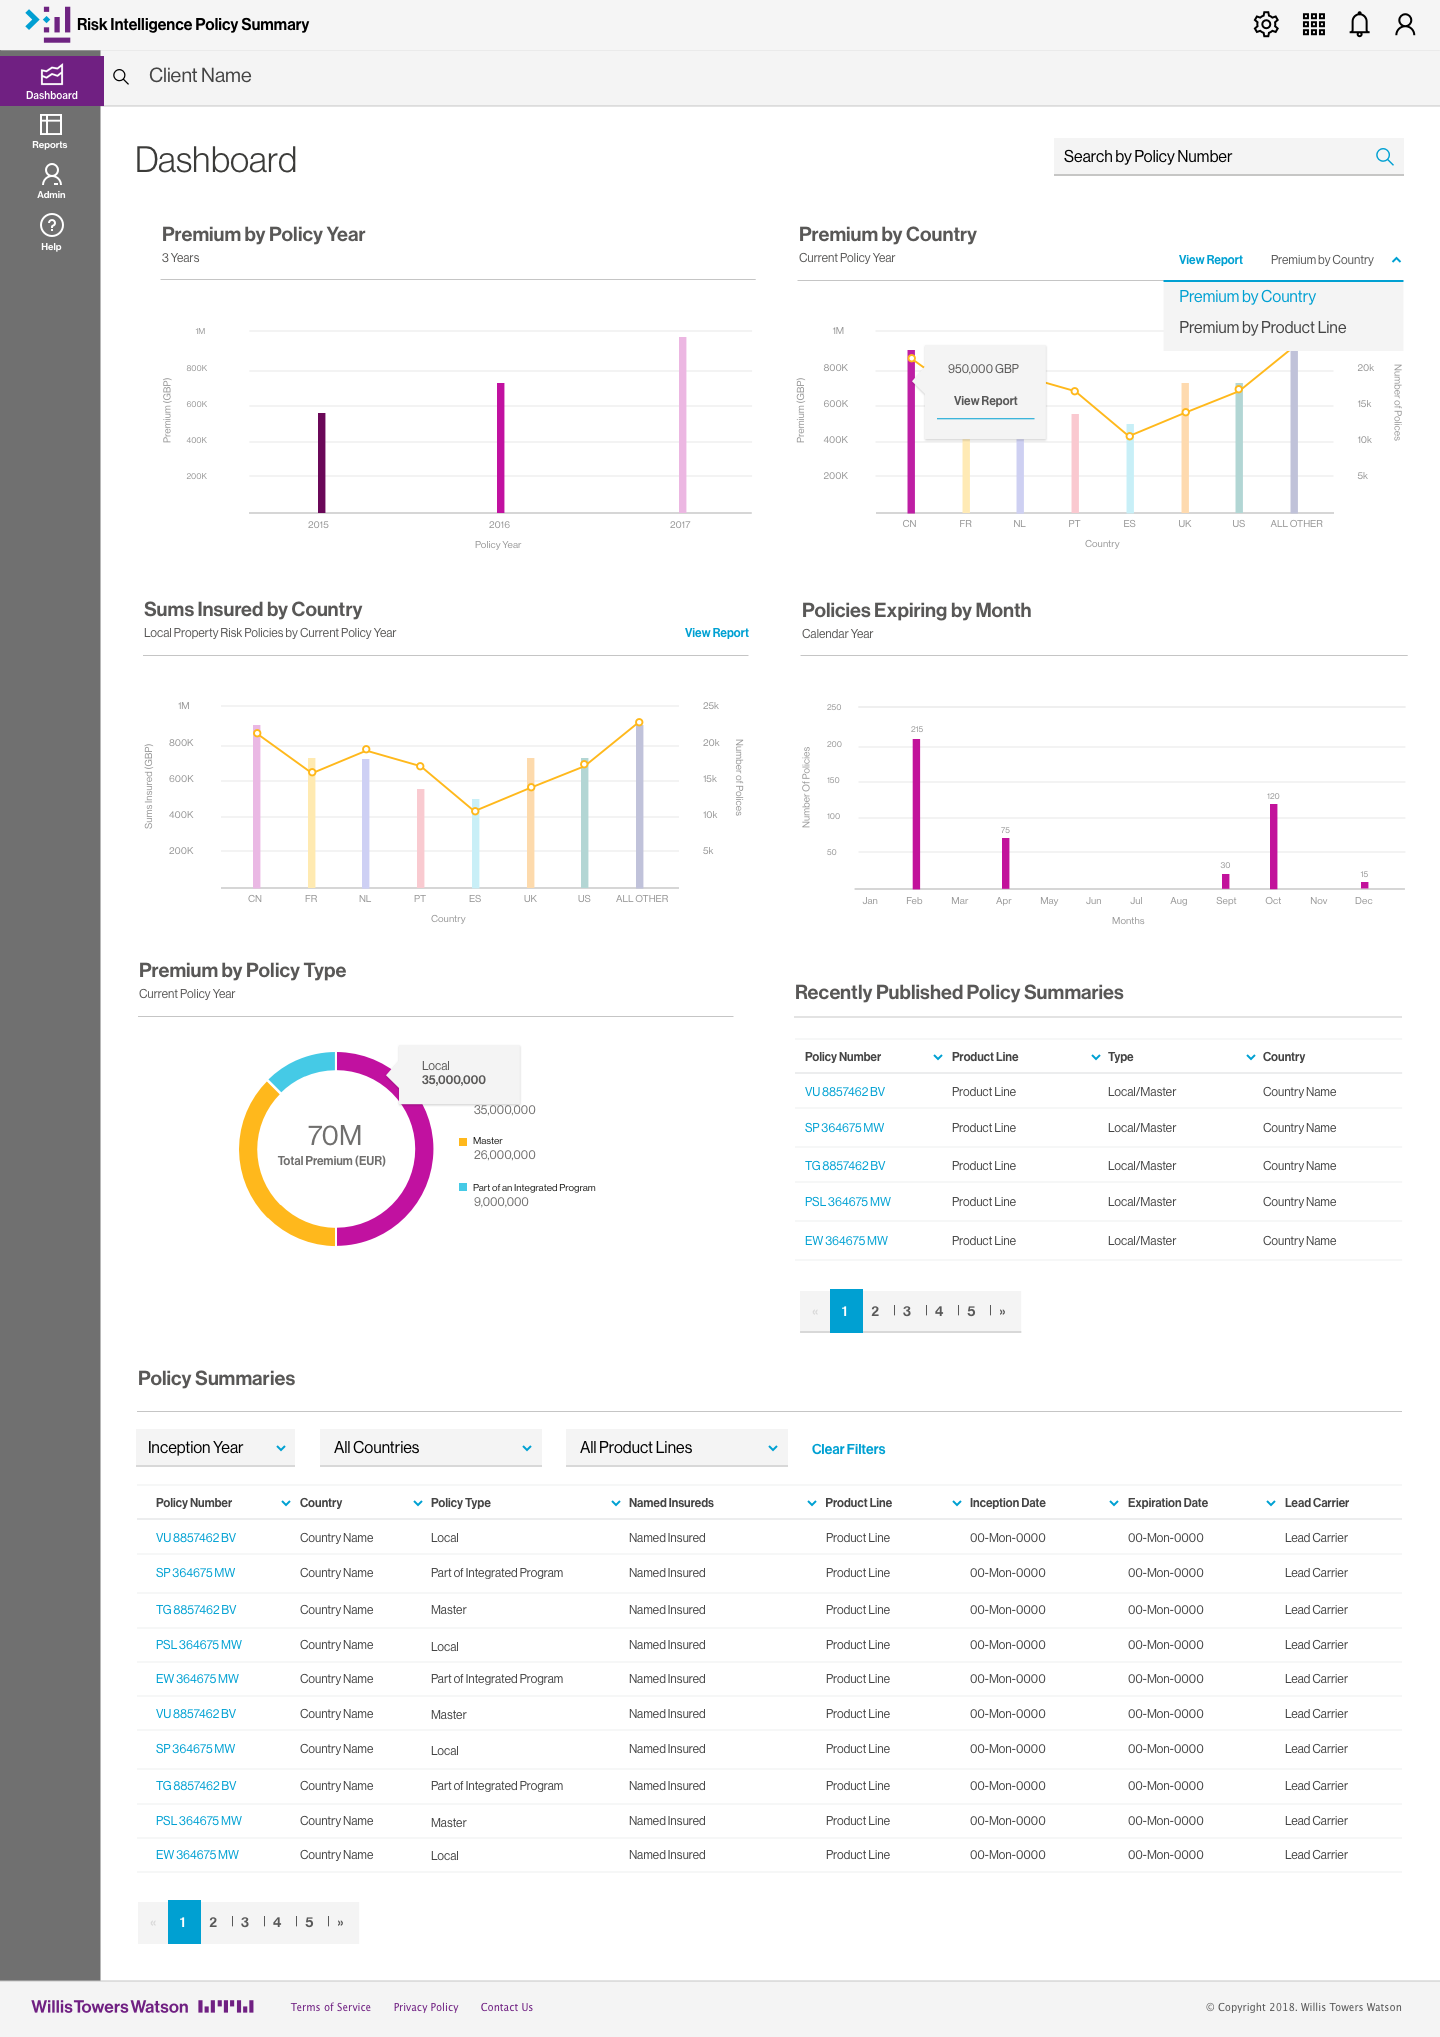
Karen views a dashboard that shows her the total cost of insurance worldwide, split by local and master policies purchase by country, and related financial information
-
Karen runs variance reports to easily see where premiums have increased, decreased against a previous policy period and coverage type.
-
Karen searches and views key information related to a policy (e.g. claims, risks), and have the ability to view various attachments related to a policy.
-
Karen tracks which policies are coming up for renewal, to ensure renewal activities are completed in time.
-
Karen uses the dashboard graphs to drill down into a report and then discusses policy renewal activities and progress with the broker.